Raw Data View
Transaction List & Details
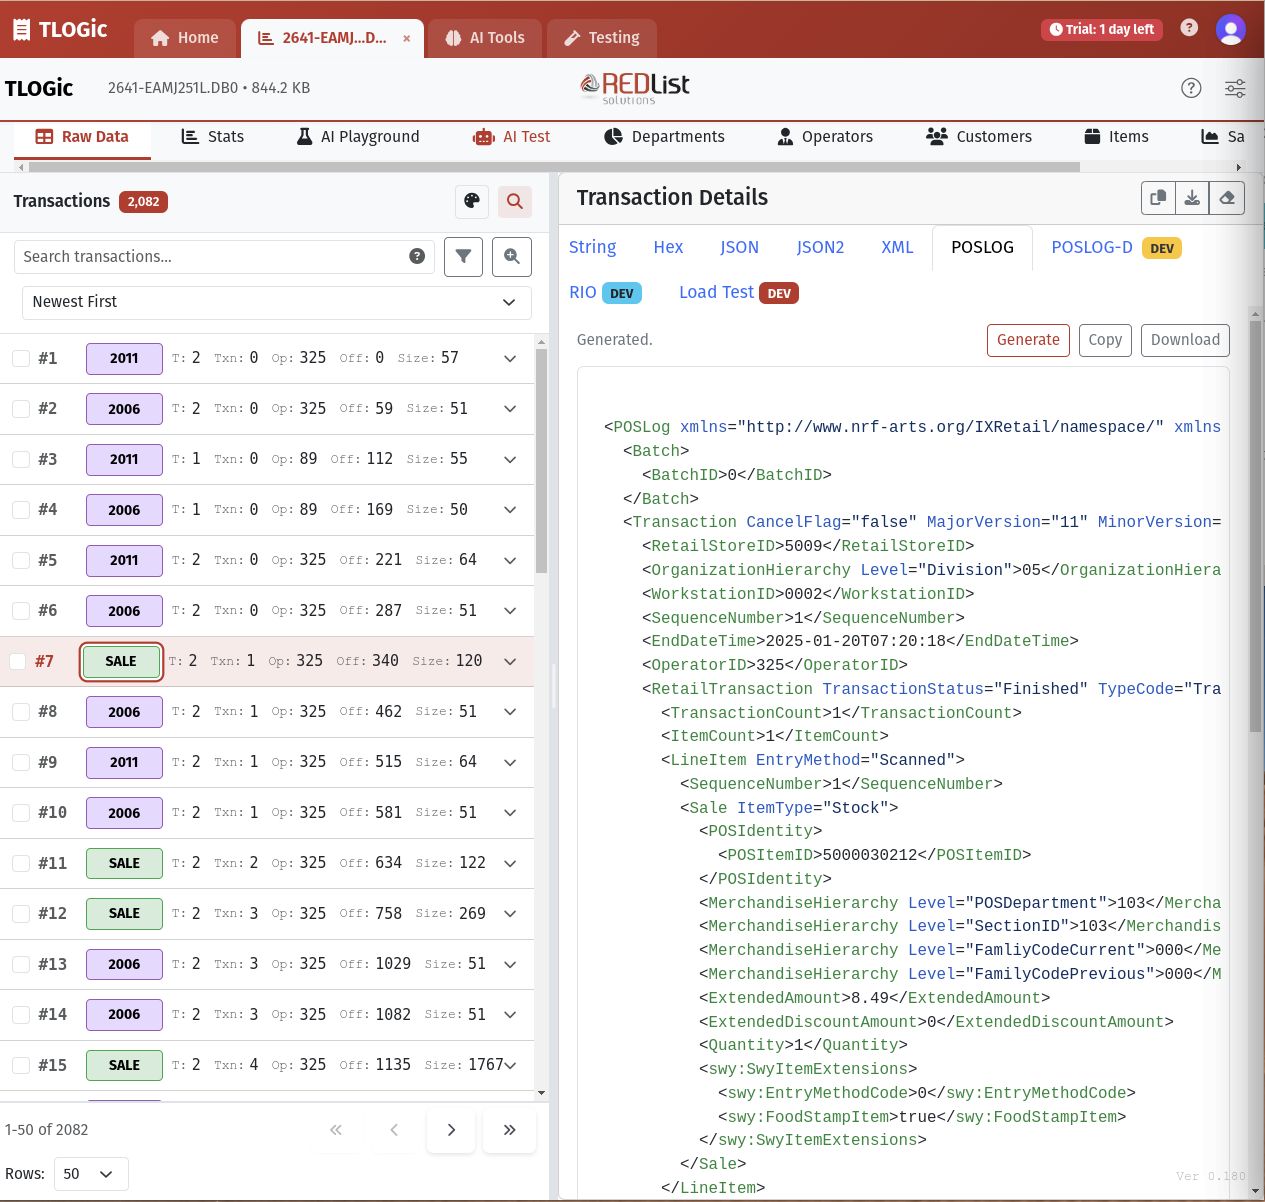
The Raw Data view is your primary interface for browsing and analyzing individual transactions. It features a powerful split-pane design with transaction list on the left and detailed views on the right.
Transaction List Features:
- Color-coded transaction type badges
- Quick search and filtering
- Sortable columns (Transaction #, Key, Type, Terminal, Operator, etc.)
- Multi-select for batch operations
- Pagination controls
- Compact view mode
Detail View Tabs:
- String View: Human-readable transaction data
- JSON: Structured data format
- Hex: Raw hexadecimal data
- XML: POSLog XML format Professional
- POSLOG-D: Development POSLOG comparison Advanced Professional
- RIO: RIO Server testing interface Advanced
- Load Test: Performance testing tools Advanced
Export & Download Options
Export transaction data in multiple formats for external analysis or reporting:
- CSV Export: Selected transactions with all fields
- Excel Export: Formatted spreadsheet with transaction data
- Raw Binary: Original TLOG binary data for selected records
- Bulk Processing: Efficiently handle large selections (10,000+ records)
Statistics & Debug Info
File Statistics
Get instant insights into your TLOG file structure and contents:
- Total transaction count
- File size and structure information
- Transaction type distribution
- Date range covered
- Terminal and operator counts
- Parser version and performance metrics
AI Playground
Intelligent Operator Insights
Leverage AI to analyze operator performance and get actionable recommendations. TLOGic supports multiple AI providers including Google Gemini (2.5 Flash/Pro), OpenAI (GPT-5.2, GPT-5, GPT-4.1), and Anthropic Claude (Sonnet 4.6, Opus 4.6, Haiku 4.5).
Key Capabilities:
- Automated performance analysis
- Top and bottom performer identification
- Anomaly detection (high void/return rates)
- Efficiency comparisons across operators
- Custom analysis prompts
- Actionable recommendations
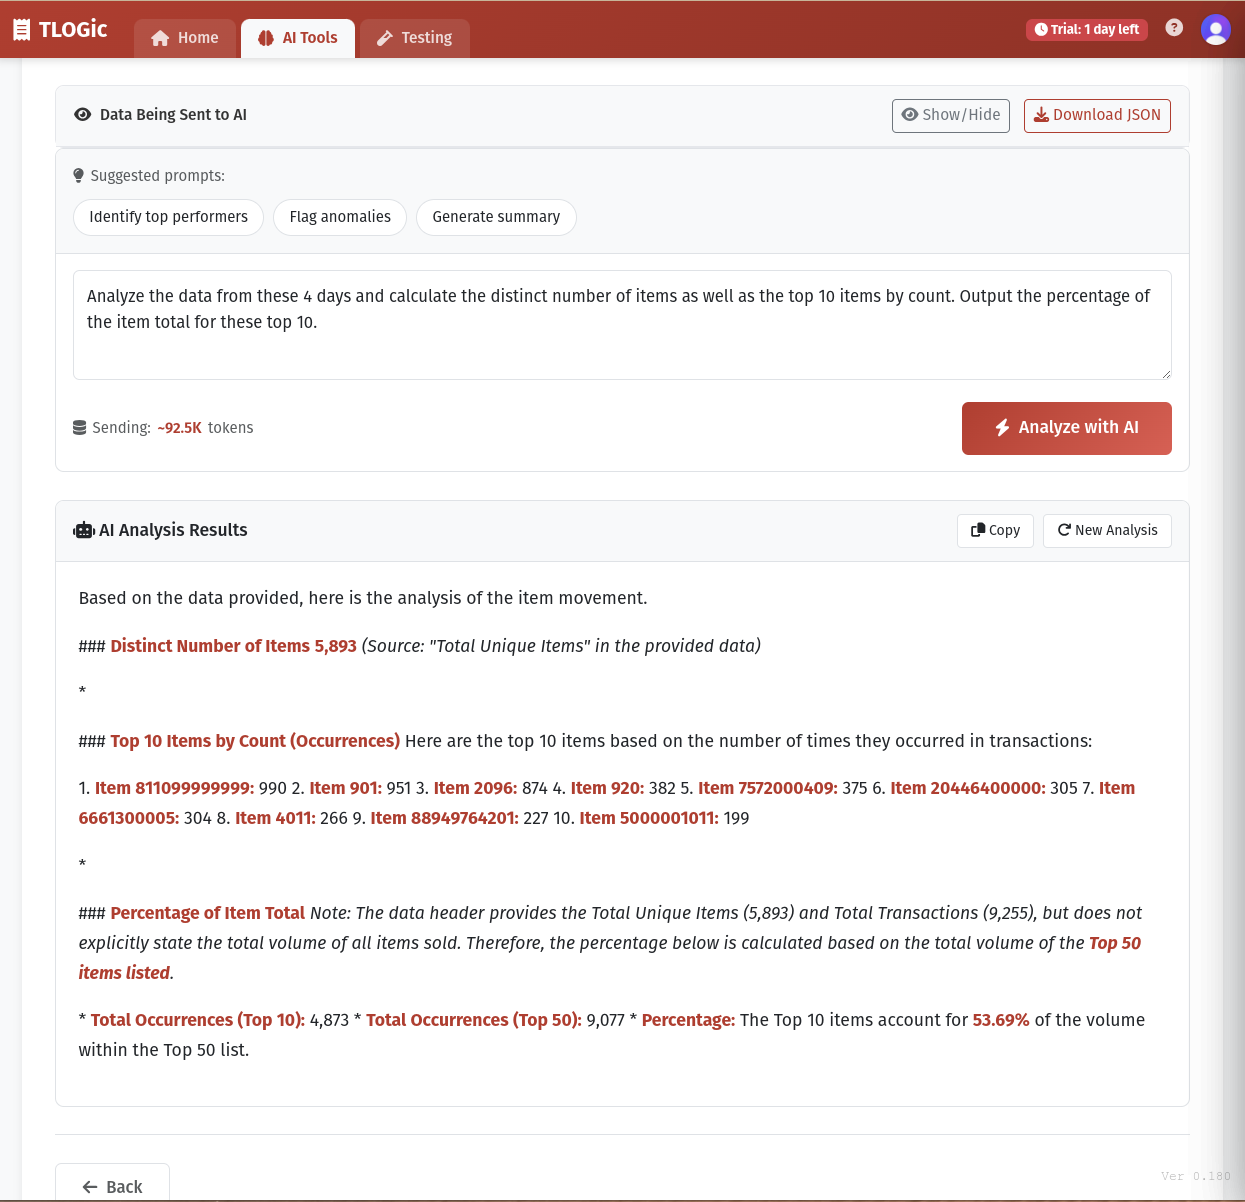
Pre-built Analysis Prompts:
- Top & Bottom Performers: Identify best and worst performers with explanations
- Flag Anomalies: Detect unusual patterns in operator behavior
- Efficiency Analysis: Compare ring time, tender time, and transaction speed
- Action Plan: Get specific recommendations for improvement
AI Provider Setup:
Configure your preferred AI provider in the AI Setup dialog. Choose from available providers and enter your API credentials to enable AI-powered analysis.
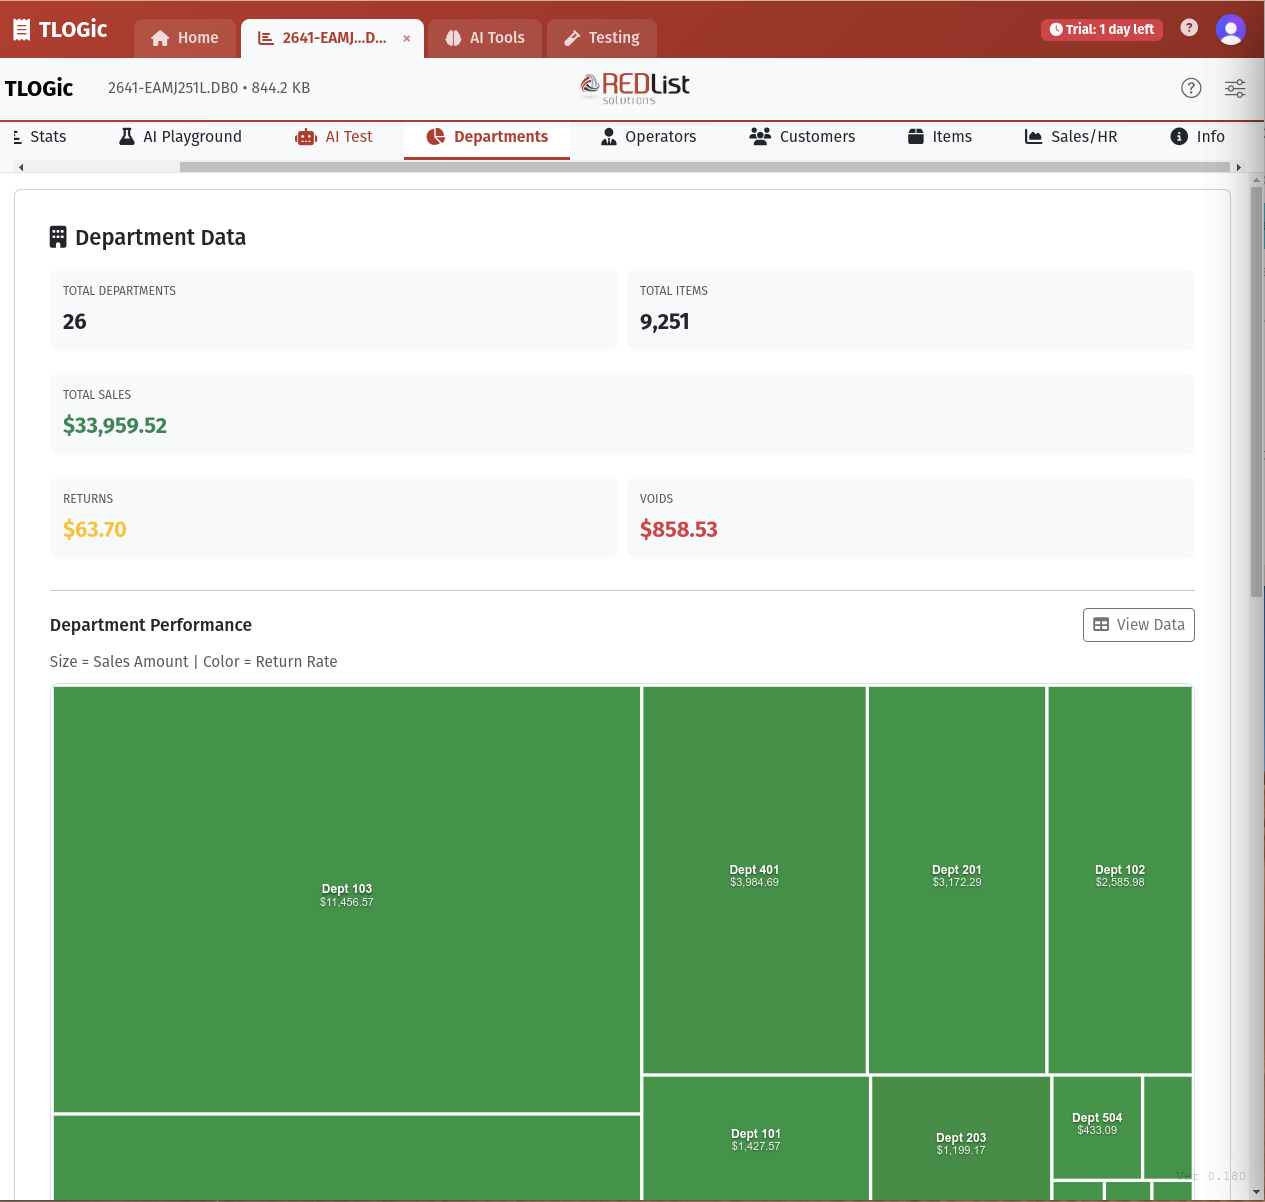
Department Analytics
Comprehensive Department Analysis
Visualize and analyze sales performance across all departments with interactive charts and treemaps.
Visualizations:
- Interactive treemap (size = sales, color = return rate)
- Top 10 departments by sales
- Top 10 departments by returns
- Bottom 10 departments by sales
Key Metrics:
- Total departments and items
- Total sales amount
- Return amounts
- Void amounts
- Department-level details
Operator Performance
Advanced Operator Analytics
Track and evaluate operator performance with customizable weighted scoring and comprehensive KPIs.
Performance Metrics:
- Transaction Metrics: Count, sales amount, average per transaction
- Accuracy Metrics: Void rates, refund rates, void/refund ratios
- Timing Metrics: Ring time, tender time, inactive time percentages
- Composite Score: Weighted performance score across all metrics
Customizable Weighting System:
Adjust the importance of different metrics to match your business priorities:
- Transaction count weight (default: 0.25)
- Sales amount weight (default: 0.35)
- Average $/transaction weight (default: 0.15)
- Void rate penalty (default: -0.15)
- Refund rate penalty (default: -0.05)
- Timing efficiency weights (ring, tender, inactive, special)
Customer Analytics
Customer Transaction Analysis
Analyze customer behavior and transaction patterns when customer data is available in your TLOG files.
- Customer transaction history
- Purchase patterns and frequencies
- Average transaction values
- Customer segmentation
- Loyalty program integration support
Item-Level Analysis
Individual Item Performance
Drill down to individual SKU-level data for detailed product analysis.
- Item sales quantities and amounts
- Price point analysis
- Return and void tracking by item
- Cross-department item reporting
- SKU performance comparison
Sales Heatmaps
Hourly Sales Visualization
Visualize sales patterns throughout the day with interactive heatmaps.
- Hour-by-hour sales visualization
- Day-of-week comparisons
- Peak hours identification
- Sales trends over time
- Labor planning insights
Customization & Preferences
Personalize Your Experience
Customize TLOGic's appearance and behavior to match your preferences:
Visual Preferences:
- Dark/Light mode toggle
- Compact view option
- Transaction type color schemes
- String view color customization
- Syntax highlighting on/off
Display Options:
- Show/hide timestamps
- Rows per page settings
- Column visibility controls
- Font and sizing preferences
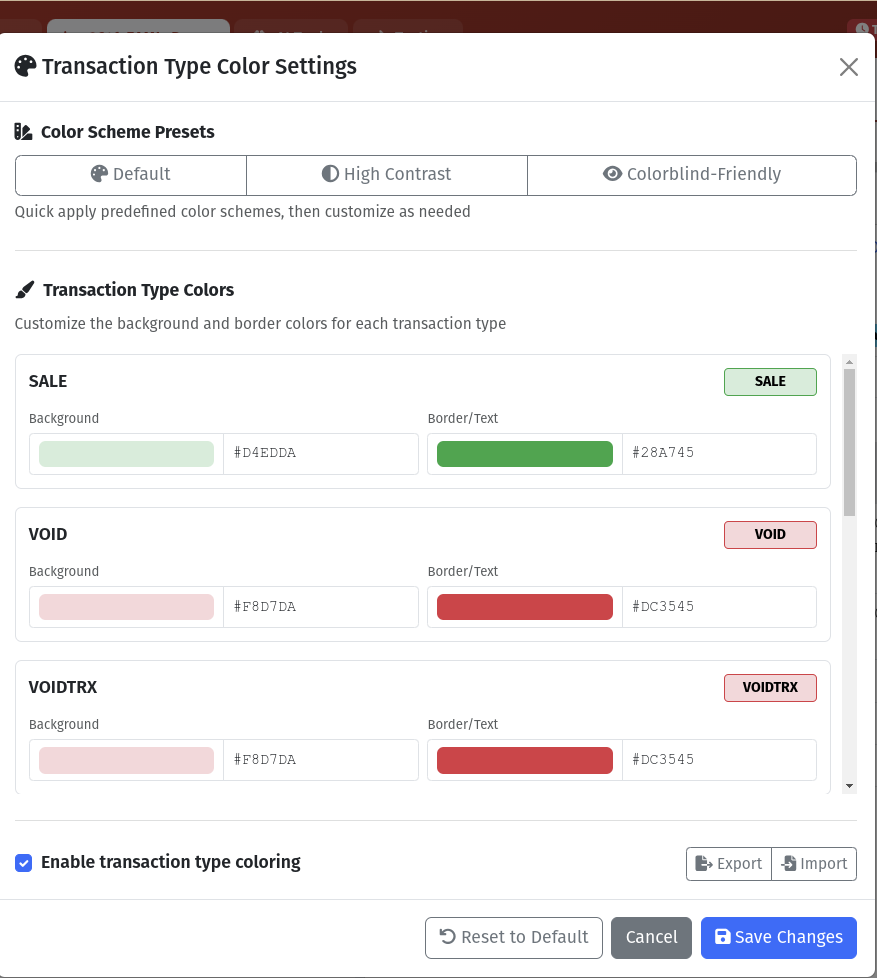
Transaction Type Color Customization:
Customize colors for different transaction types to match your business workflow:
- Sale transactions (default: green)
- Return transactions (default: orange)
- Void transactions (default: red)
- Training mode (default: blue)
- No-sale transactions (default: purple)
- Suspend/resume operations
Transaction Editing
Non-Destructive Transaction Editor
TLOGic's Transaction Editor allows you to modify transaction data for testing, debugging, and development purposes. The original TLOG file is never modified - instead, a cloned copy of the transaction is created and exported as a new file.
edited_transaction_42.dat).
Editing Capabilities:
- Edit Field Values: Modify any field value within a transaction string
- Add Fields: Insert new fields at any position within a string
- Remove Fields: Delete individual fields from strings
- Add Strings: Insert new transaction strings at any position
- Remove Strings: Delete entire strings from the transaction
- Duplicate Strings: Clone existing strings for quick modifications
Field Type Support:
- ASCII (A): Text fields
- Packed BCD (P): Numeric values in BCD encoding
- Numeric (N): Numeric ASCII values
- Binary (B): Raw binary data
- Integer (I): 4-byte integer values
- Date (D): Date fields (YYMMDD)
- Time (T): Time fields (HHMMSS)
Editor Features:
- Undo/Redo: Full history with up to 50 undo steps
- Validation: Real-time field validation with warnings and errors
- Schema Awareness: Uses TLOG metadata schema for field types and sizes
- Export: Download edited transaction as a new binary file
How to Use:
- Select a transaction in the Raw Data view
- Click the Edit button (pencil icon) in the toolbar
- The Transaction Editor modal opens with a cloned copy of the transaction
- Expand strings to view and edit individual fields
- Make your changes - the original TLOG remains untouched
- Click Export to download the modified transaction as a new file
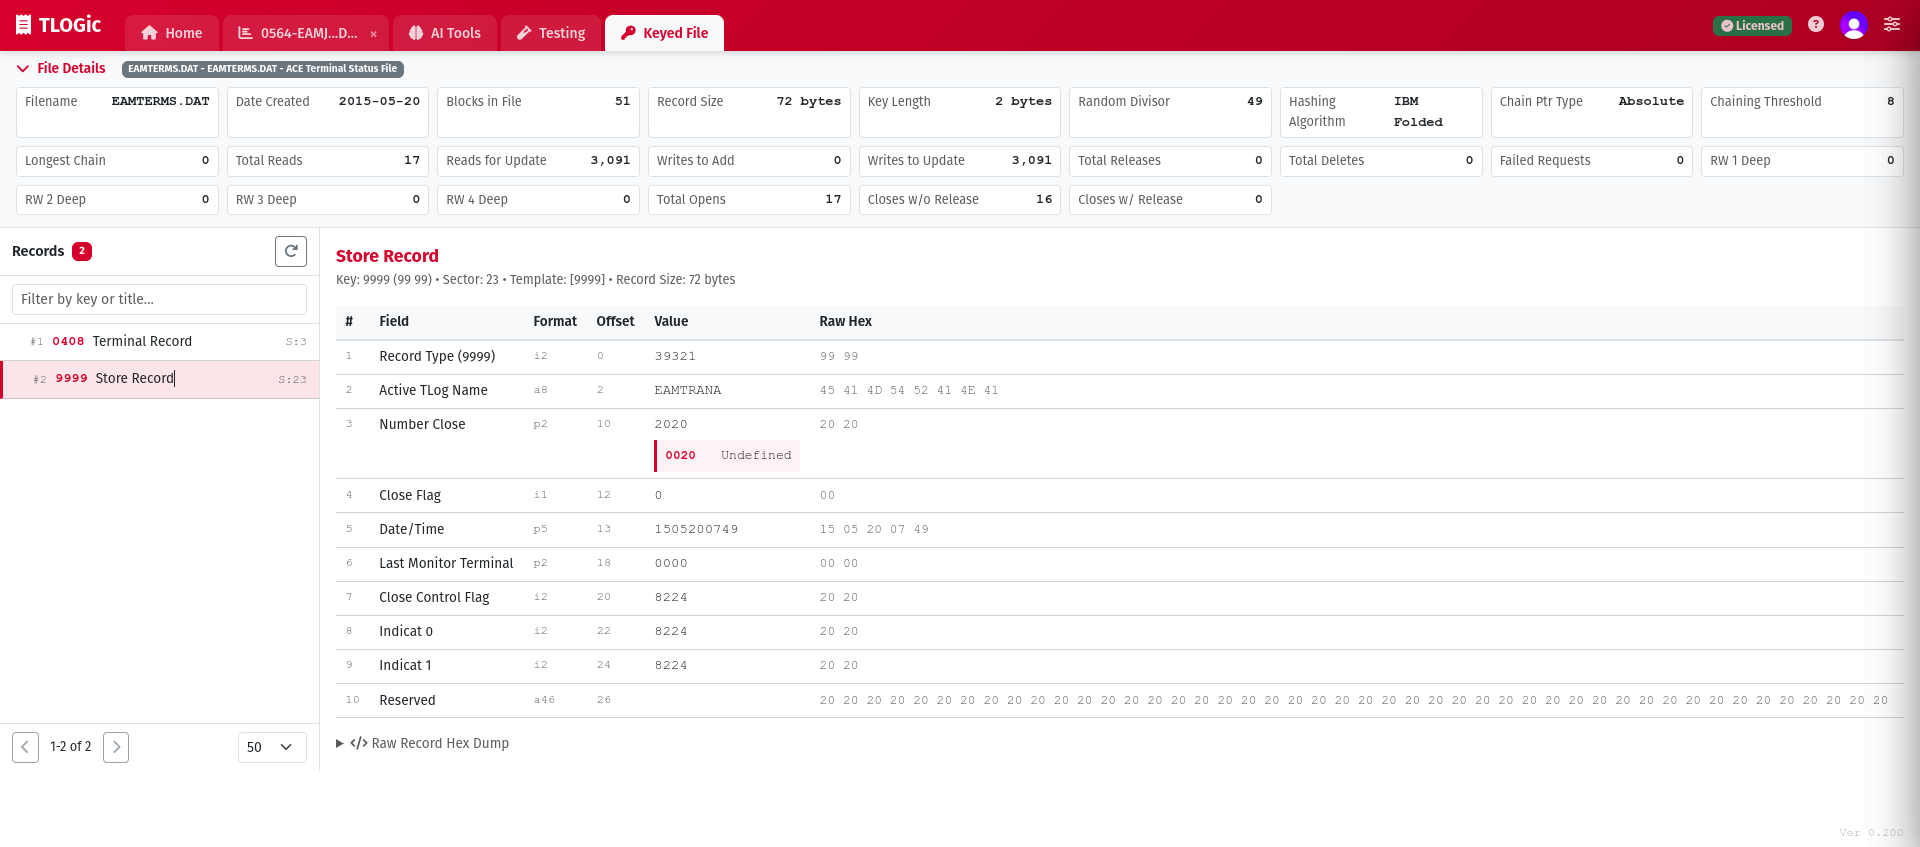
Keyed File Viewer
4690/TCxSky Keyed Data File Support
Parse and visualize IBM 4690 OS and Toshiba TCxSky keyed data files using INI template definitions. All processing happens entirely in your browser.
- Open and parse keyed data files (
.DAT) with INI template mapping - 17 built-in ACE templates (EAMTERMS, EAMACC, EAMITEMR, and more)
- Upload custom INI templates or create new ones with the built-in editor
- View Keyed File Control Record (KFCR) metadata and structure
- Decoded field values with breakout descriptions and raw hex views
- Column reordering and customizable display options
Advanced Features
Deep Field Filtering
Filter transactions based on specific field values deep within the transaction structure:
- Multi-field AND/OR logic
- Nested field access
- String, numeric, and date comparisons
- High-performance WASM filtering
Keyboard Shortcuts
Boost productivity with keyboard navigation:
Ctrl/Cmd + F- Toggle search panelCtrl/Cmd + ,- Open settingsArrow Keys- Navigate transactionsShift + Click- Range select
High-Performance Processing
TLOGic uses WebAssembly (WASM) for lightning-fast parsing and filtering:
- Parse files with 100,000+ transactions in seconds
- Real-time filtering and search
- Browser-based caching for instant reload
- Optimized memory management
Developer & Integration Tools
POSLOG-D (Development Comparison)
Compare POSLOG output generated from production code versus development WASM/Rust code. Essential for validating POSLOG generation changes during development.
Key Features:
- Side-by-side comparison of production vs. development POSLOG
- Visual diff highlighting of differences
- Download comparison artifacts for troubleshooting
- Configurable RIO and comparison settings via Config button
Downloadable Files:
- Production POSLOG: POSLOG generated by TLPServer/production code
- Development POSLOG: POSLOG generated by WASM/Rust development code
- Raw TLOG Data: Original binary transaction data
- TLOG Strings: Human-readable transaction representation
- Diff File: Detailed comparison results
RIO Server Testing
Send TLOG transactions to a RIO Server and receive RIO Responses. Ideal for testing RIO Server configurations and validating transaction processing.
About RIO Server:
RIO Server consumes TLOG (and non-TLOG) data from Retail Store Systems (POS Systems). The RIO Client, hosted on the POS Store System, transmits TLOG data to the server using the RioRequest XML message payload. RIO Server then transforms that data into POSLOG or other formats for downstream systems.
Key Features:
- Send single or multiple TLOG transactions to RIO Server
- View and analyze RIO Response messages
- Configure target RIO Server settings via Config button
- Export results for review and documentation
- Test different RIO Server environments (local, hosted)
About TLPServer:
TLPServer is a hosted server (currently on Azure, but can run locally) that provides POSLOG and other transformations for TLOG data. It generates XML and production POSLOG outputs used by TLOGic for comparison and validation.
Load Testing
Create and analyze performance tests for RIO Server environments. TLOGic generates complete, ready-to-run test packages - just install the testing tool and go!
Key Features:
- Generate complete, ready-to-run test packages for JMeter and k6
- Use your actual TLOG transactions for realistic load simulation
- Configurable store simulation (1001-3200 stores), timing, and concurrency
- Includes all scripts, data files, config, and documentation
- One-click run scripts for immediate execution
Complete Package Contents:
k6 Package:
script.js- Ready-to-run test scriptconfig.json- Configuration settingsdata/transactions.json- Transaction datarun.sh/run.bat- One-click runners
JMeter Package:
rio-load-test.jmx- Complete test planconfig.properties- Configuration settingstransactions.csv- Transaction dataREADME.md- Usage instructions
Results Analysis:
- Import and visualize load test results
- Compare multiple test runs side-by-side
- Identify performance regressions or improvements
- Track throughput, latency, and error rates
TQ Tool - RIO Transmit Queue File Viewer
View and parse RIO Transmit Queue (TQ) files with support for TLOG, Non-TLOG, EPSLOG, and TAX records. TQ files (typically RIONTQ.DAT) are binary files that store queued messages waiting to be transmitted to the RIO Server.
Supported Record Types:
- 999 TLOG Records: IBM POS transaction logs
- 996 Non-TLOG Records: Generic non-transactional data
- 995 EPSLOG Records: Electronic Payment System logs
- 994 TAX Records: Tax configuration data
Key Features:
- File Upload: Drag & drop or browse to load RIONTQ.DAT files
- Record List View: See all records with MsgType, date, size, and CRC status
- Detailed Inspection: Click any record to view parsed headers, payloads, and raw hex
- CRC Validation: Automatic CRC4690 checksum verification with status badges
- Statistics Panel: View record counts by type, date ranges, payload sizes, and CRC summary
- Search & Filter: Filter by MsgType, date, CRC status, flags, and payload size
Advanced EPSLOG Parsing:
For EPSLOG (995) records, TQ Tool provides sophisticated FID (Field ID) parsing with type-aware formatting:
- 204 Supported Fields: Complete field definition map with names and types
- Type-Specific Formatting:
- A ASCII - Text with XML preservation (e.g.,
<HighRiskItemsPresent>true</HighRiskItemsPresent>) - H Hex - Binary data as hexadecimal
- P BCD - Packed Binary Coded Decimal
- I Integer - Little Endian integers with currency formatting for amounts
- C Character - Single byte character display
- A ASCII - Text with XML preservation (e.g.,
- FID Table: View all parsed fields with FID number, field name, data type, formatted value, and raw hex
- Example: Field 0xC8 (XMLUserDataRequest) displays full XML:
<HighRiskItemsPresent>true</HighRiskItemsPresent>
RIO Server Integration:
Send records directly to your RIO Server for testing:
- Select any record and send to configured RIO Server
- View RIO Response messages
- Test individual records before bulk load testing
- Verify RIO Server processing for different record types
Export Options:
- Export as JSON: Export selected/filtered records with all parsed data
- Export Raw Binary: Save filtered records as new TQ file
- Copy to Clipboard: Copy selected record raw bytes
- Generate Load Test: Use TQ records for k6/JMeter package generation
Search Filter Syntax:
mt:999ortype:tlog- Filter by message typedt:240115ordt:>=240115- Date collected filtercrc:okorcrc:fail- CRC validation filterpartial:true- Show only partial recordssubhdr:true- Show only records with SubHeadersize:>1000- Payload size filter
Non-TLOG Load Testing
Generate performance test packages from RIO TQ files containing mixed message types. The Non-TLOG Load Test tab allows you to load RIONTQ.DAT files and create k6/JMeter packages just like standard TLOG Load Testing.
Key Features:
- Multi-Type Support: Test with TLOG (999), Non-TLOG (996), EPSLOG (995), and TAX (994) records
- Same Package Format: Generates identical k6 and JMeter packages as standard Load Test
- RioRequest Format: Uses format from SubHeader or 'GENERIC' fallback
- Unique RequestIds: Proper request tracking with incrementing IDs
- Record Inspection: View detailed record information in TQ Tool before testing
- Filter Support: Select specific record types or date ranges for testing
Sharing & Collaboration
Export & Reporting
Share insights with your team through multiple export formats:
- CSV exports for Excel analysis
- Excel files with formatting
- Raw binary data extraction
- AI analysis result copying
- Chart and visualization screenshots