About Load Testing
TLOGic's Load Test tab allows you to generate complete test packages for industry-standard load testing tools. Use your actual TLOG transactions to simulate realistic store traffic against your RIO Server, measuring performance, throughput, and identifying bottlenecks.
Complete Ready-to-Run Packages
TLOGic provides everything you need - just install the testing tool and run! Each exported package includes:
script.js- Complete test script, ready to executeconfig.json- All configuration settingsdata/transactions.json- Your TLOG transaction dataREADME.md- Detailed usage instructionsrun.sh/run.bat- One-click run scripts
rio-load-test.jmx- Complete test plan, ready to openconfig.properties- All configuration settingstransactions.csv- Your TLOG transaction dataREADME.md- Detailed usage instructions
No scripting required! Simply install k6 or JMeter, extract the ZIP, update the server URL in the config file, and run.
Overview
The Load Test feature generates complete, self-contained test packages that you can run immediately on your own infrastructure. TLOGic does all the heavy lifting - generating scripts, encoding transaction data, and configuring test parameters. You just need to install the testing tool and run. TLOGic supports two popular load testing frameworks:
k6
A modern, developer-friendly load testing tool written in Go. Uses JavaScript for test scripts with powerful CLI options.
- JavaScript-based test scripts
- Low resource consumption
- Great for CI/CD pipelines
- Built-in cloud integration
Apache JMeter
The industry-standard Java-based load testing tool with a graphical interface and extensive plugin ecosystem.
- Graphical test builder
- Extensive plugin ecosystem
- Distributed testing support
- Detailed reporting
Which Tool Should I Use?
| Criteria | k6 | JMeter |
|---|---|---|
| Best For | Developers, CI/CD automation, modern workflows | QA teams, complex test scenarios, GUI-based testing |
| Learning Curve | Easy if you know JavaScript | Moderate - GUI helps but can be complex |
| Resource Usage | Very low (Go-based) | Higher (Java-based) |
| Scripting | JavaScript (ES6) | XML + optional Groovy/BeanShell |
| Distributed Testing | Via k6 Cloud or custom setup | Built-in master/slave architecture |
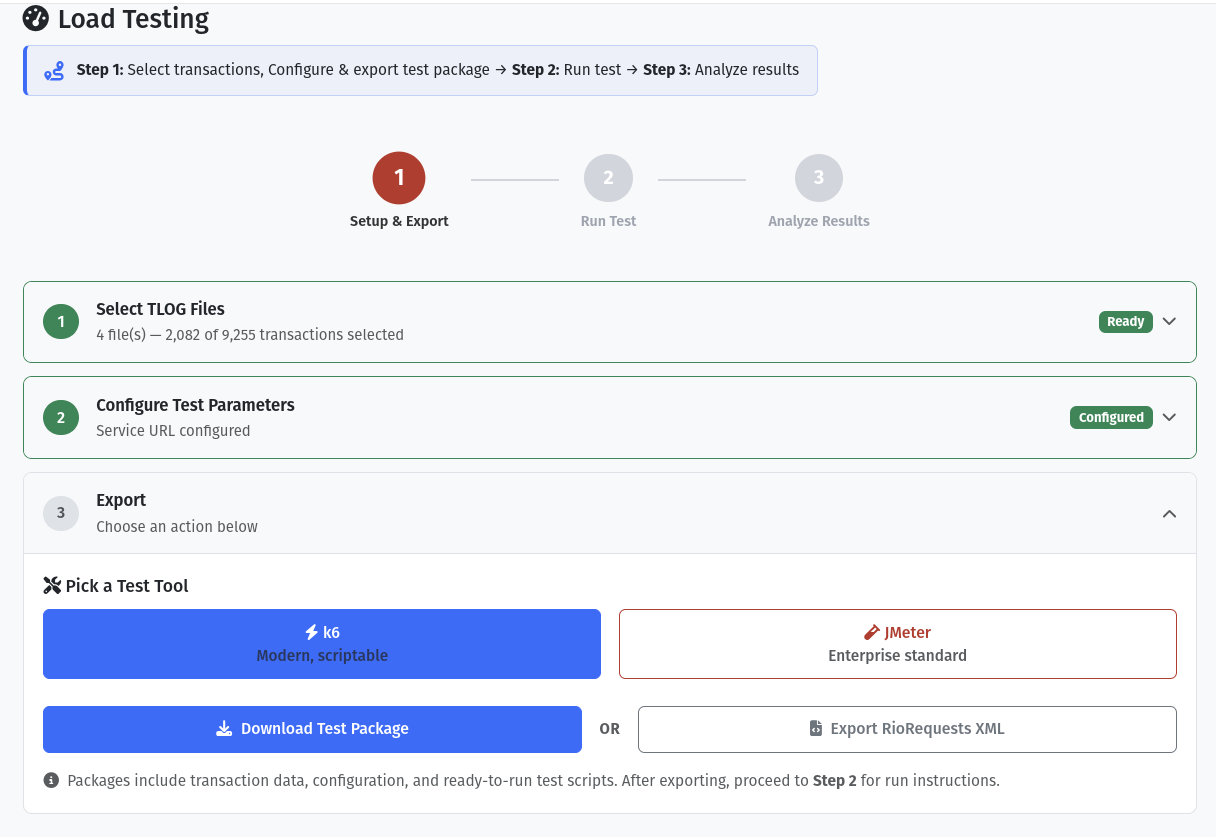
Getting Started
- Load a TLOG File: Open TLOGic and load the TLOG file containing the transactions you want to use for testing.
- Filter Transactions (Optional): Use search and filtering to select specific transactions for your test. Only filtered transactions will be included in the test package.
- Navigate to Load Test Tab: Click on the Load Test tab in the transaction details panel.
- Configure Settings: Click the Config button to set up your RIO server URL, store range, and timing parameters.
- Export Package: Click Export k6 Package or Export JMeter Package to download a ZIP file.
- Run the Test: Extract the package and run the test using your chosen tool.
Configuration Options
Click the Config button in the Load Test tab to customize these settings:
| Setting | Default | Description |
|---|---|---|
| Service URL | (required) | Your RIO Server endpoint URL (e.g., https://rio.example.com/api/tlog) |
| Start Store | 1001 | First store number in the simulation range |
| End Store | 3200 | Last store number in the simulation range |
| Max Concurrent | 2200 | Maximum number of concurrent virtual users (stores) |
| Ramp Up (seconds) | 30 | Time to gradually increase to max concurrent users |
| Duration (minutes) | 5 | How long to sustain peak load |
| Ramp Down (seconds) | 30 | Time to gradually decrease users after test |
| Delay Min/Max (ms) | 100-500 | Random delay between requests per store (simulates real behavior) |
| Basic Auth User/Pass | (optional) | Credentials for HTTP Basic Authentication |
| Format | BBBY | RioRequest format identifier |
| Division | 05 | Division code for RioRequest |
| UTC Offset | -05:00 | Timezone offset for transaction timestamps |
k6 Load Testing Guide
- Install k6 (one-time setup)
- Extract the ZIP file TLOGic generates
- Edit config.json with your RIO server URL
- Run!
k6 run script.js
Step 1: Install k6 (One-Time Setup)
Install k6 on your testing machine. This only needs to be done once:
macOS (Homebrew)
Windows (Chocolatey)
Linux (Debian/Ubuntu)
sudo gpg --no-default-keyring --keyring /usr/share/keyrings/k6-archive-keyring.gpg --keyserver hkp://keyserver.ubuntu.com:80 --recv-keys C5AD17C747E3415A3642D57D77C6C491D6AC1D69
echo "deb [signed-by=/usr/share/keyrings/k6-archive-keyring.gpg] https://dl.k6.io/deb stable main" | sudo tee /etc/apt/sources.list.d/k6.list
sudo apt-get update
sudo apt-get install k6
Step 2: Configure Your Test
After exporting and extracting the k6 package, edit config.json:
maxConcurrent values (e.g., 100) for initial testing, then gradually increase to find your server's limits.
Step 3: Run the Test
Basic Run
k6 run script.js
Run with JSON Output (for TLOGic Analysis)
Override Duration and VUs from Command Line
Run with Real-time Console Output
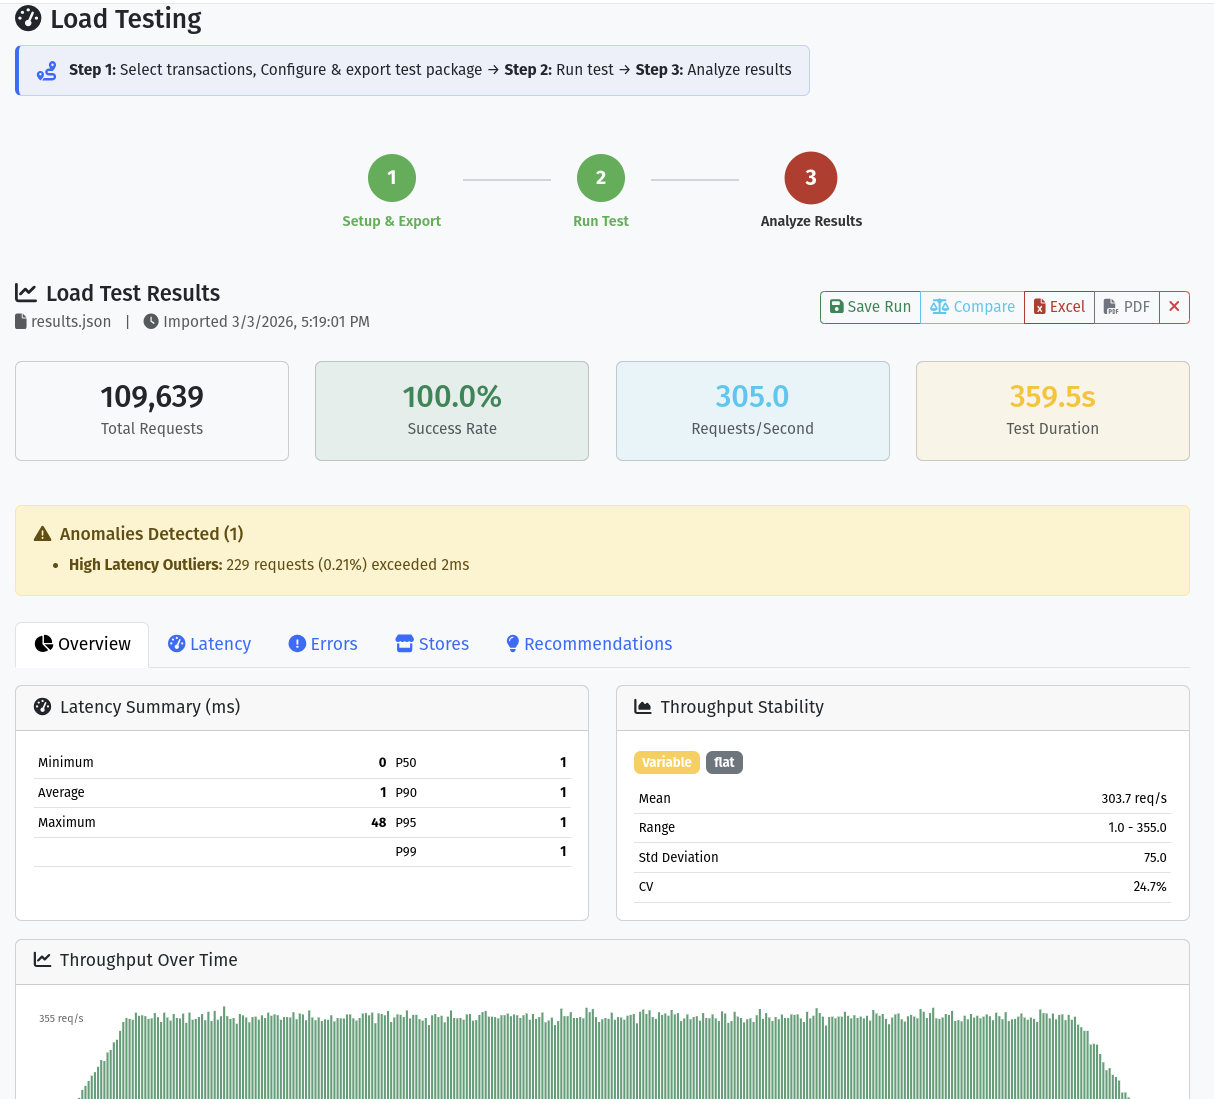
Step 4: Analyze Results
k6 displays a summary in the console after each run:
Key metrics to monitor:
- http_req_duration: Response time statistics (aim for p95 < 2s)
- rio_success_rate: Percentage of successful requests (aim for > 95%)
- http_reqs: Total requests and requests per second
JMeter Load Testing Guide
- Install JMeter (one-time setup)
- Extract the ZIP file TLOGic generates
- Open the .jmx file in JMeter
- Update the server URL in User Defined Variables
- Run! Click the green play button or use command line
Step 1: Install JMeter (One-Time Setup)
- Download JMeter from https://jmeter.apache.org/
- Extract the archive to your preferred location
- Ensure you have Java 8+ installed (
java -version)
Windows
jmeter.bat
macOS/Linux
./jmeter.sh
Step 2: Open the Test Plan
After exporting and extracting the JMeter package:
- Open JMeter GUI
- File → Open
- Navigate to the extracted folder and select
rio-load-test.jmx
The test plan includes:
- User-defined variables for easy configuration
- CSV data set for transaction data
- HTTP request sampler with RioRequest XML template
- Response assertions for success validation
- Summary report and aggregate report listeners
Step 3: Configure the Test
Edit the User Defined Variables in the test plan:
| SERVICE_URL | Your RIO Server endpoint |
| AUTH_TOKEN | Base64-encoded credentials (leave empty if not needed) |
| THREADS | Number of concurrent threads (stores) |
| RAMP_UP | Ramp-up period in seconds |
| DURATION | Test duration in seconds |
Step 4: Run the Test
GUI Mode (for development/debugging)
Click the green play button in the JMeter toolbar.
Non-GUI Mode (for production tests)
Parameters:
-n: Non-GUI mode-t: Test plan file-l: Log file for results-e: Generate HTML report-o: Output folder for HTML report
Step 5: Analyze Results
JMeter provides several ways to analyze results:
- Summary Report (GUI): Real-time statistics during the test
- Aggregate Report (GUI): Detailed metrics by sampler
- HTML Report: Comprehensive report with charts (use
-e -oflags) - JTL File: Raw results that can be opened in JMeter or analyzed with other tools
Key metrics in JMeter reports:
| Average | Mean response time in milliseconds |
| 90% Line | 90th percentile response time |
| Error % | Percentage of failed requests |
| Throughput | Requests per second |
| KB/sec | Data transfer rate |
Non-TLOG Load Test (RIO TQ Files)
RIO TQ File Support
TLOGic supports load testing with RIO Transmit Queue (TQ) files! The Non-TLOG Load Test tab allows you to load RIONTQ.DAT files and generate k6/JMeter packages just like the standard TLOG Load Test, but with support for multiple record types including Non-TLOG, EPSLOG, TAX, and TLOG records.
This is particularly useful for testing RIO Server performance with diverse message types that may be queued for transmission in production environments.
What are RIO TQ Files?
RIO Transmit Queue (TQ) files, typically named RIONTQ.DAT, are binary files that store queued messages waiting to be transmitted to the RIO Server. Each record in a TQ file has a 24-byte header followed by variable-length data:
| Field | Size | Description |
|---|---|---|
| VLI | 2 bytes (LE) | Variable Length Indicator - length of payload data |
| MsgType | 2 bytes (LE) | Message type: 999 (TLOG), 996 (Non-TLOG), 995 (EPSLOG), 994 (TAX) |
| DtCollected | 12 bytes | Date/time collected (YYMMDDhhmmss ASCII) |
| Flags | 1 byte | Record flags (CRC present, SubHeader present, partial record flags) |
| CRC | 4 bytes (LE) | CRC32 checksum (if flag 0x08 set) |
| Filler | 3 bytes | Reserved (ignored) |
| Payload | VLI bytes | Variable-length message data |
Supported Record Types
999 TLOG Records
Standard IBM POS transaction logs. These contain the same TLOG data as the files loaded in the main TLOG Load Test feature.
Use Case: Testing mixed transaction processing from queued files
996 Non-TLOG Records
Generic non-transactional data messages. These are comma-separated value records for various non-POS data.
Use Case: Testing non-transactional data processing
995 EPSLOG Records
Electronic Payment System logs. These contain payment processing data with structured FID (Field ID) format.
Use Case: Testing payment system integration and EPS data flow
994 TAX Records
Tax configuration data records. These contain alternating key/value pairs for tax rate definitions.
Use Case: Testing tax configuration updates and processing
Using Non-TLOG Load Test
- Navigate to Non-TLOG Load Test Tab: In the Testing workspace, click the Non-TLOG Load Test tab.
-
Upload RIO TQ File: Drag and drop your
RIONTQ.DATfile or click the file input button. TLOGic will parse all records and display statistics showing the breakdown by MsgType. - Review Records: View the parsed records in the list. Each record shows its MsgType, date collected, payload size, and CRC status. You can also navigate to the TQ Tool tab to view detailed record information with parsed payloads.
- Filter Records (Optional): Use the search/filter functionality to select specific record types or date ranges for your load test.
- Configure Settings: Click the Config button to set up your RIO server URL, store range, and timing parameters (same configuration options as standard TLOG Load Test).
- Generate Test Package: Click Generate k6 Package or Generate JMeter Package. TLOGic will create a complete test package with proper RioRequest XML messages for each record.
- Run Your Test: Extract the package and run using k6 or JMeter, following the same instructions as the standard TLOG Load Test above.
Non-TLOG vs Standard TLOG Load Test
| Feature | Standard TLOG Load Test | Non-TLOG Load Test |
|---|---|---|
| Input File Format | IBM TLOG files (pure transaction data) | RIO TQ files (RIONTQ.DAT with 24-byte headers) |
| Record Types Supported | TLOG records only (999) | TLOG (999), Non-TLOG (996), EPSLOG (995), TAX (994) |
| Record Viewing | Transaction list in main UI | TQ Tool tab for detailed record inspection |
| RioRequest Format | Standard TLOG RioRequest | Generic RioRequest with format from SubHeader or 'GENERIC' fallback |
| Use Case | Testing POS transaction processing | Testing queued message processing with mixed message types |
| Generated Packages | k6 and JMeter packages | k6 and JMeter packages (same format) |
RioRequest Format for Non-TLOG Records
When generating load test packages from TQ files, TLOGic constructs RioRequest XML messages with the following characteristics:
- Unique RequestId: Each request gets a unique incrementing ID (k6 uses
VU * 1000000 + iteration) - Format Field: Extracted from SubHeader
ftypeproperty if present, otherwise uses 'GENERIC' - FileName: Extracted from SubHeader
fnameproperty if present, otherwise uses the TQ filename - Source: Set to
tlogic-non-tlog-load-testto identify test origin - Base64 Payload: The record's payload data is Base64-encoded and included in
<PosFileData>
Example RioRequest from Non-TLOG Load Test
Best Practices
Do This
- Start with low concurrency and gradually increase
- Run tests from a machine close to your RIO server
- Monitor server resources during tests (CPU, memory, network)
- Use realistic transaction data from production TLOGs
- Run multiple test iterations to establish baselines
- Test during off-peak hours to avoid impacting production
- Document your test configurations and results
- For TQ files: Use the TQ Tool to inspect records before load testing
- For TQ files: Verify CRC validation status to ensure data integrity
Avoid
- Running high-load tests against production without approval
- Using unrealistic delay settings (0ms between requests)
- Ignoring warm-up periods for the server
- Testing from a machine with limited network bandwidth
- Running JMeter GUI mode for production tests
- Comparing results from different network conditions
- For TQ files: Load testing with records that have CRC validation errors
Troubleshooting
Connection Refused Errors
- Verify the
serviceUrlis correct and accessible - Check firewall rules on both the test machine and RIO server
- Ensure the RIO server is running and accepting connections
- Try accessing the URL with curl:
curl -v https://your-rio-server/api/tlog
Authentication Errors (401/403)
- Verify the authToken is correctly Base64-encoded
- Format should be:
base64(username:password) - Check if credentials are expired or locked
- Ensure the user has permissions to access the RIO endpoint
Low Throughput
- Increase
maxConcurrentor thread count - Reduce delay between requests
- Check network latency between test machine and server
- Monitor server resources for bottlenecks
- Ensure test machine has sufficient resources
High Error Rates
- Check server logs for error details
- Reduce load to find the threshold where errors begin
- Verify transaction data format is correct
- Check for connection pool exhaustion on the server
- Look for timeout-related errors and adjust timeouts if needed