About AI Playground
TLOGic's AI Playground uses AI to analyze your TLOG data and provide actionable insights. Analyze operators, departments, items, tenders, and more across multiple TLOG files to identify trends, detect anomalies, and get recommendations. TLOGic supports multiple AI providers including Google Gemini, OpenAI, and Anthropic Claude.
New: Multi-File Analysis
Analyze data across multiple TLOG files to discover trends over time, compare performance across days or weeks, and get deeper insights from accumulated data.
How AI Analysis Works
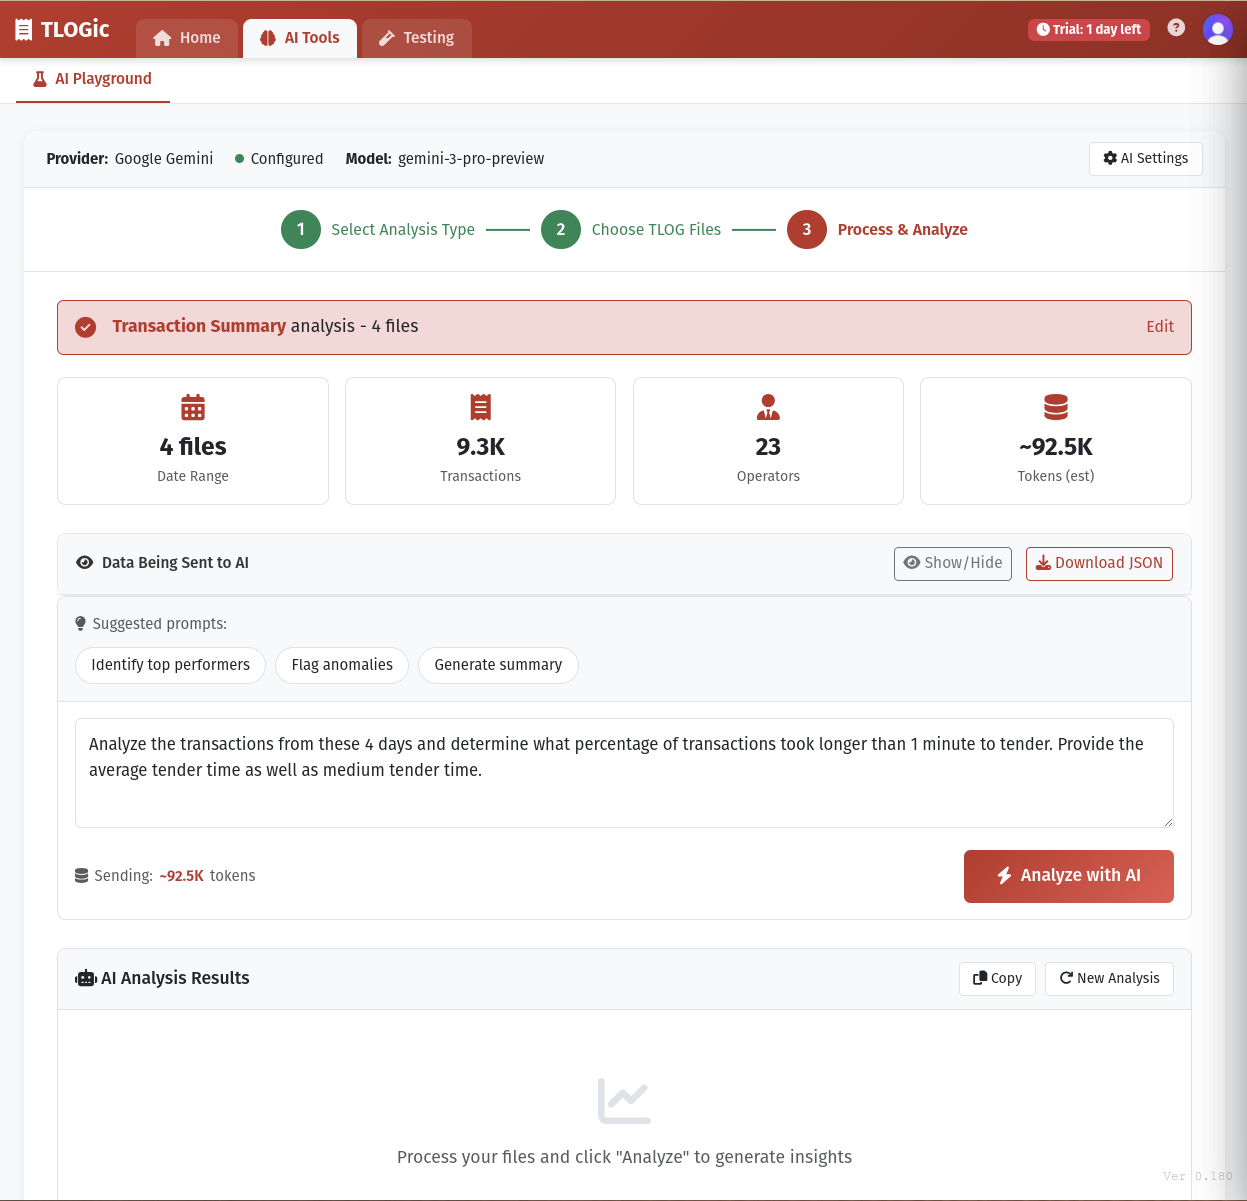
TLOGic's AI Playground uses a streamlined 3-step wizard to guide you through the analysis process:
- Step 1 - Select Analysis Type: Choose what you want to analyze: Operators, Departments, Tenders, Items, Transactions, or create a Custom selection. Each category pre-selects relevant data fields.
- Step 2 - Choose TLOG Files: Drag and drop or select one or more TLOG files. Multiple files enable trend analysis across days, weeks, or months.
- Step 3 - Process & Analyze: TLOGic processes your files, aggregates the data, and presents suggested prompts. Enter your question and click "Analyze with AI" to get insights.
Analysis Categories
Operators
Sales, voids, ring times, efficiency metrics per operator
Departments
Revenue by department, returns, void amounts, trends
Tenders
Payment methods, cash handling, tender mix analysis
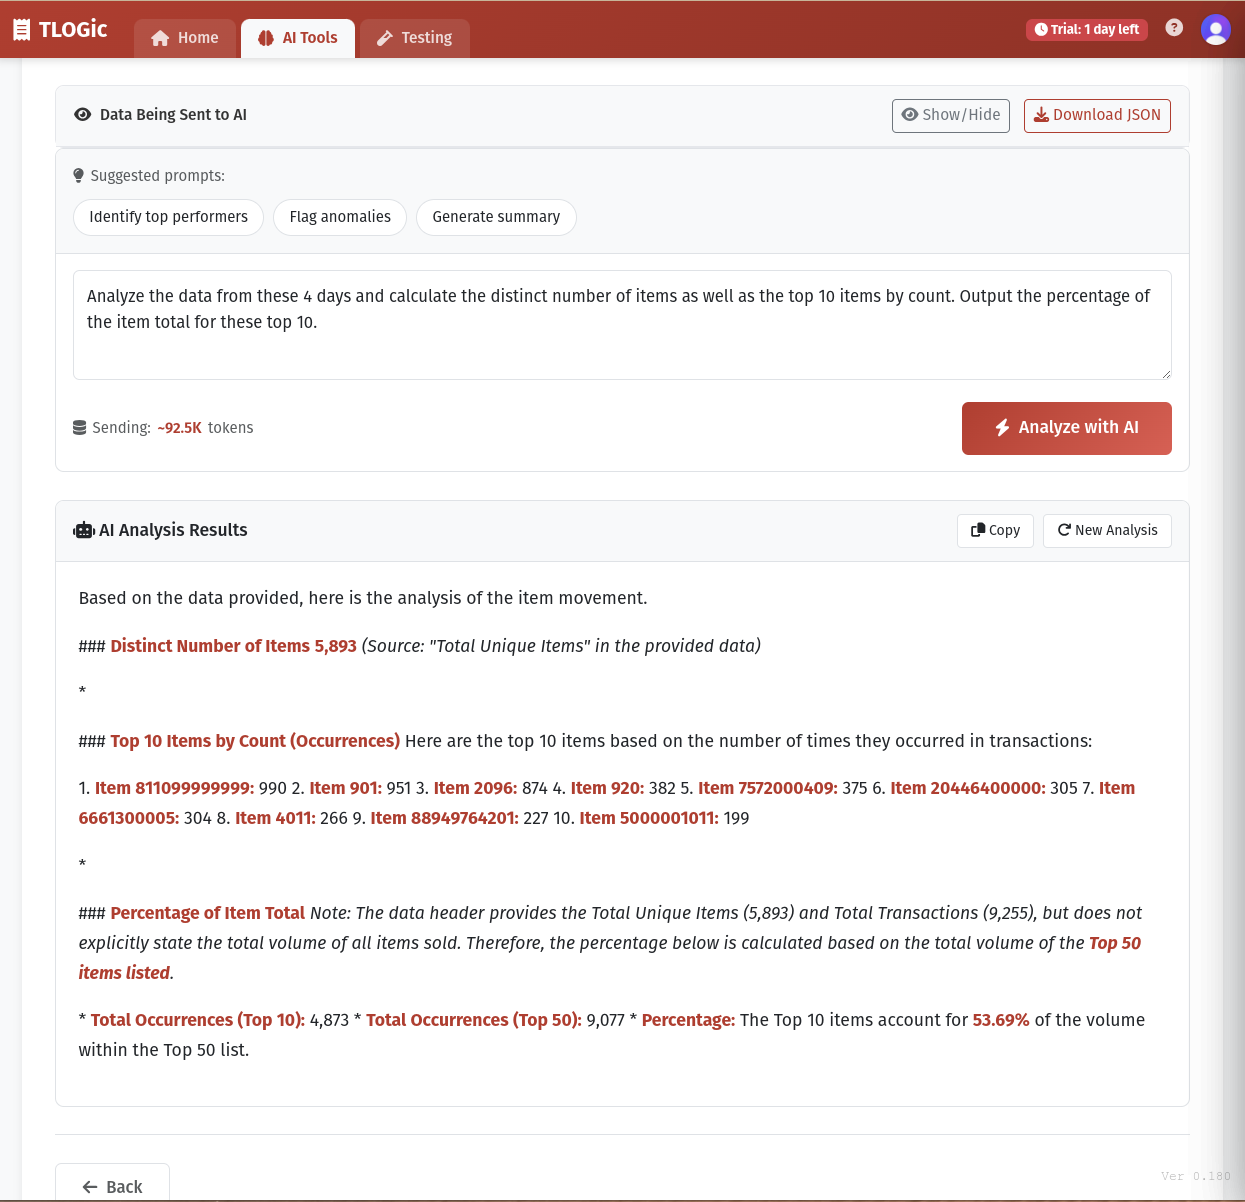
Items
Top sellers, quantities, pricing, item movement
Transactions
Overview stats, timing, counts, averages
Custom
Choose specific fields manually from any category
AI Provider Setup
Before using AI analysis, you need to configure your preferred AI provider:
- Click the AI Settings button in the AI Playground
- Select your preferred AI provider
- Enter your API key for the selected provider
- Choose your preferred model (if available)
- Save your settings
Supported AI Providers
Google Gemini
Gemini 2.5 Flash, Flash-Lite, and Pro models with thinking capabilities. Fast and cost-effective.
Models: Gemini 2.5 Flash, Flash-Lite, Pro
Get API KeyOpenAI
GPT-5.2 (latest), GPT-5, GPT-4.1 family. Industry-leading language understanding.
Models: GPT-5.2, 5.1, 5, 5-Mini, 5-Nano, 4.1, 4.1-Mini, 4.1-Nano, 4o
Get API KeyAnthropic Claude
Claude Sonnet 4.6 (latest), Opus 4.6, and Haiku 4.5. Excellent reasoning for complex analysis.
Models: Sonnet 4.6, Opus 4.6, Sonnet 4.5, Haiku 4.5
Get API Key Requires Local ProxyClaude Setup (Local Proxy Required)
Anthropic's Claude API doesn't allow direct browser requests (CORS policy). Unlike Gemini and OpenAI, Claude blocks requests that come from web browsers. Our lightweight proxy:
- Runs entirely on your computer (not on TLOGic servers)
- Forwards your requests to
api.anthropic.com - Adds the necessary headers so Claude accepts the request
- Your API key is never sent to or stored by TLOGic
- Open source - about 80 lines of code you can inspect
Step 1: Install Docker
If you don't have Docker installed, download Docker Desktop for your operating system.
Step 2: Start the Claude Proxy
Open a terminal and run:
docker run -d -p 3001:3001 --name claude-proxy jb4690world/tlogic-claude-proxy
This downloads and starts the proxy. It will run in the background on port 3001.
Step 3: Verify It's Running
The proxy should show as "Running" when you select Claude in AI Settings. You can also verify manually:
curl http://localhost:3001/health
Should return: {"status":"healthy","proxy":"claude"}
Managing the Proxy
Stop Proxy
docker stop claude-proxy
Start Proxy
docker start claude-proxy
Remove Proxy
docker rm -f claude-proxy
Using AI Playground
Single-File Analysis
- Load a TLOG file in TLOGic
- Navigate to the AI Playground tab
- Select an analysis category (Operators, Departments, etc.)
- Click Next and confirm file selection
- Wait for processing to complete
- Enter your question or select a suggested prompt
- Click "Analyze with AI"
Multi-File Analysis
Analyze trends across multiple days, weeks, or months by loading multiple TLOG files:
- Navigate to the AI Playground tab
- Select an analysis category
- In Step 2, drag and drop multiple TLOG files or click to browse
- Add files from different dates (e.g., each day's TLOG)
- TLOGic aggregates data and tracks daily breakdowns
- Use multi-file specific prompts like "Compare performance across days" or "Track trends over time"
Pre-Built Analysis Prompts
TLOGic includes four pre-built prompts designed for common analysis scenarios:
Top & Bottom Performers
Best for: Identifying high performers for recognition and low performers who may need training or support. Provides specific metrics that differentiate top and bottom operators.
Flag Anomalies
Best for: Detecting potential issues with accuracy, training, or possible policy violations. The AI considers context and suggests root causes.
Efficiency Analysis
Best for: Identifying operators who may benefit from speed and efficiency training. Highlights slow transaction processing times.
Action Plan
Best for: Getting concrete next steps and improvement strategies based on the current team's performance patterns.
Data Transparency & Download
Before sending data to AI, you can see exactly what will be sent:
- Token Estimate: The UI shows an estimated token count for the data being sent
- Download Data: Click the "Download Data" button to save a JSON file containing exactly what will be sent to the AI
- Data Summary: View statistics about the processed data (date range, transaction count, operator count)
Writing Custom Prompts
For more specific analysis, write your own custom prompts in the text area. Here are tips for effective prompts:
Be Specific
Good Example:
"Which operators have void rates above 5% and what is their average transaction value compared to the team average?"
Avoid:
"Tell me about the operators."
Ask for Actionable Insights
Good Example:
"Based on the performance data, which 2 operators should I prioritize for advanced training and why?"
Avoid:
"Who is good?"
Combine Multiple Metrics
Good Example:
"Identify operators with both high sales amounts AND low void rates. What techniques might they be using that others could learn from?"
Common Use Cases
Single-File Analysis
Training Needs
Prompt: "Which operators have ring times more than 20% slower than average? What specific areas should training focus on?"
Use this to identify skill gaps and create targeted training programs.
Recognition Programs
Prompt: "Rank operators by their composite performance score. Who are the top 5 and what specific achievements should be highlighted?"
Identify high performers for employee recognition and rewards.
Team Benchmarking
Prompt: "What is the median performance for each key metric? Which operators are above/below these benchmarks?"
Establish performance standards and identify outliers.
Loss Prevention
Prompt: "Are there any operators with unusual patterns in their void/refund activity that might warrant further investigation?"
Detect potential policy violations or fraud indicators.
Multi-File Analysis
Performance Trends
Prompt: "Compare operator performance across the loaded dates. Who improved? Who declined? What patterns do you see?"
Track performance changes over time.
Department Trends
Prompt: "Track daily sales trends by department. Which departments are growing? Which are declining?"
Identify sales patterns and seasonal shifts.
Item Movement
Prompt: "Identify emerging bestsellers and declining products. Which items are gaining popularity over time?"
Spot product trends and inventory insights.
Payment Trends
Prompt: "Analyze how payment methods are changing over time. Is cash declining? Are mobile payments increasing?"
Understand payment method evolution.
Understanding AI Results
AI analysis results typically include:
- Specific Findings: Concrete observations about operator performance
- Comparative Analysis: How operators compare to each other and team averages
- Root Cause Suggestions: Possible reasons for performance patterns
- Recommendations: Actionable steps to improve performance
- Priority Guidance: Which issues or operators to address first
Limitations & Considerations
Important Notes
- Data Quality: AI insights are only as good as the data in your TLOG file. Incomplete or inaccurate data will lead to less reliable analysis.
- Context Matters: The AI doesn't know your store's specific circumstances, policies, or staffing challenges. Use its insights as a starting point, not absolute truth.
- Privacy: Operator performance data is sent to your configured AI provider for analysis. Review your provider's privacy policy and ensure compliance with your organization's data policies.
- Verification: Always verify AI findings with your own knowledge of the operators and business context before taking action.
- API Costs: AI API usage may incur costs depending on your provider and plan. Monitor your usage accordingly.
Best Practices
Do This
- Run analysis after loading fresh, recent data
- Use specific, focused prompts
- Compare AI findings with your observations
- Run multiple analyses from different angles
- Save useful analyses for future reference
- Share insights with management teams
Avoid
- Making personnel decisions based solely on AI
- Running analyses on partial or corrupt files
- Using vague, open-ended prompts
- Ignoring context and circumstances
- Sharing raw AI output without interpretation
- Over-relying on AI instead of human judgment
Troubleshooting AI Analysis
AI Analysis Fails or Times Out
- Check your internet connection
- Ensure the TLOG file has operator data
- Try a shorter, simpler prompt
- Wait a moment and try again (temporary service issues)
Results Don't Make Sense
- Verify your TLOG file has complete, accurate data
- Check if the prompt was clear and specific
- Try rephrasing your question
- Run a pre-built prompt to verify AI is working correctly
Generic or Unhelpful Responses
- Make your prompt more specific
- Include metric thresholds (e.g., "above 10%")
- Ask for specific numbers and examples
- Request actionable recommendations